
AI systems are moving beyond isolated experiments. They now summarize customer records, retrieve enterprise data, recommend actions, route requests, and trigger workflow steps.
That shift changes what teams need to monitor.
For traditional software, a healthy system often means the service is available, response times are acceptable, and error rates remain low. Those signals still matter for AI. However, they do not show whether the system retrieved the right context, called the correct tool, followed the expected policy, or produced a useful business outcome.
An AI agent can return a successful response while still acting on outdated data or routing work to the wrong owner.
This is why AI observability is becoming a production requirement. Teams need enough visibility to understand what the AI received, how it interacted with other systems, what it did, and where the workflow failed.
The goal is not perfect access to a model’s internal reasoning. It is a reviewable trail from context to action and outcome.
Why Traditional Monitoring Is Not Enough for AI Systems
Traditional application monitoring focuses on infrastructure and service health.
Teams usually track signals such as:
- Availability
- Latency
- Request volume
- Error rates
- Resource usage
- API failures
These metrics remain essential. They can show whether the system is slow, unavailable, or failing to communicate with another service.
However, AI systems can fail even when all of those metrics look normal.
Consider an AI assistant that helps employees process purchase requests. It receives a request, queries the supplier database, checks the budget, and sends the case to an approver.
The service returns a response within two seconds. No API call fails. Infrastructure dashboards remain green.
Yet the workflow may still be wrong because the AI:
- Retrieved an expired supplier record
- Used an outdated purchasing policy
- Missed a required compliance check
- Selected the wrong approver
- Passed incorrect parameters to a workflow tool
From a technical perspective, the system completed the request. From an operational perspective, it failed.
This is the core difference between monitoring and AI observability.
Microsoft Foundry’s observability guidance describes AI observability as the ability to monitor, understand, and troubleshoot AI systems across their lifecycle. It combines logs, traces, evaluations, model outputs, and operational signals to provide visibility into performance, quality, safety, and system health.
AI systems also behave differently from deterministic software. The same input may not always produce the same output, especially when prompts, retrieved context, tool responses, or model versions change.
Therefore, a single error message is rarely enough to explain a failure.
Teams need to reconstruct the wider execution path.
Observability will not make a probabilistic system fully predictable. However, it can make the evidence around that system much easier to inspect.
What Production AI Teams Need to Observe
The main unit of AI observability should not be the final response alone.
Teams need visibility across the full chain:
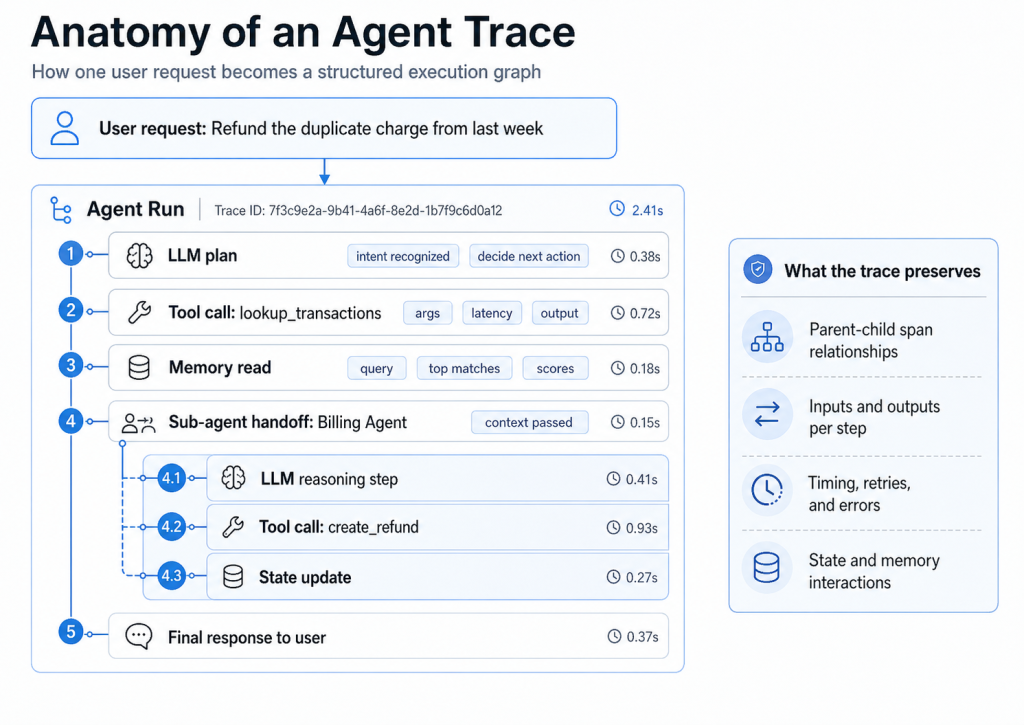
Input → context → retrieval → model interaction → tool call → action → outcome
That chain is where many production failures occur.
1. Inputs and operating context
Teams first need to know what the AI received.
This may include:
- The user prompt
- System instructions
- Previous conversation history
- Current workflow state
- Retrieved documents
- CRM or ERP records
- User identity and permissions
- Model and prompt versions
This context matters because an incorrect output does not always indicate a weak model.
The system may have received incomplete instructions. A required record may have been missing. The user may not have had permission to access the information needed for a stronger answer.
For example, an AI assistant may incorrectly report that a customer order is ready for delivery. The model may have interpreted the available data correctly, but the workflow failed to provide the latest payment status.
Without a record of the context, the team may spend time adjusting the model instead of fixing the integration.
A practical trace should make it possible to answer:
- What information was available?
- Which information was missing?
- Which user and workflow initiated the request?
- Which model and prompt version were active?
- Which permissions shaped the result?
You cannot debug an AI output properly without reconstructing the context that shaped it.
2. Retrieval and data lineage
Retrieval is a major part of many enterprise AI systems.
Internal assistants, enterprise search, and retrieval-augmented generation systems often query documents, databases, CRM records, policies, and other sources before generating an answer.
It is not enough to log that retrieval occurred.
Teams should also know:
- Which source was searched
- Which query was used
- Which records were returned
- How each result was ranked
- How current the information was
- Whether sources conflicted
- Which retrieved items influenced the output
OpenTelemetry’s generative AI conventions include fields for retrieval queries, retrieved documents, model requests, responses, system instructions, and tool-call arguments. These conventions aim to provide a common structure for tracing AI behavior across systems.
This matters when two systems disagree.
Suppose an AI assistant retrieves one customer address from CRM and another from ERP. If the final answer contains the wrong address, the team needs to see both records and understand why one source received priority.
Without data lineage, teams may only see the incorrect output. They cannot identify where the inconsistency entered the workflow.
3. Tool calls and business actions
Tool calls create the greatest operational risk because they allow AI to change business systems.
An AI agent may:
- Update a CRM field
- Create a purchase request
- Send a notification
- Route an approval
- Modify a project record
- Trigger a downstream automation
For each action, teams should record:
- Which tool was selected
- The parameters sent to the tool
- The tool response
- Retries and failures
- Approval status
- The affected business record
- Changes made in downstream systems
This creates a clear difference between an AI answer and an AI action.
A weak answer can be corrected. An incorrect tool call may create duplicate records, notify the wrong person, or move a workflow forward before required conditions are met.
Google Cloud’s guidance on agent observability notes that AI agents can drift, regress silently, take unexpected actions, and fail differently from conventional software. It recommends observing execution paths and agent behavior so teams can diagnose and improve reliability.
Once AI can act, observability becomes part of operational control.
4. Decision paths, policies, and escalation
Teams also need to see how the system moved from information to action.
That does not mean exposing a hidden chain of thought. Production teams should focus on observable evidence and external decision steps.
Useful signals include:
- Which policy or rule applied
- Which workflow branch was selected
- Confidence or uncertainty indicators
- Why escalation was or was not triggered
- Whether human review was required
- Who approved the action
- Which safeguards blocked or changed the result
For example, an AI agent may classify a request as low risk and approve an automated route. The trace should show which rule created that classification and whether the required data was present.
If the system skips escalation, the team needs to know whether the issue came from the risk threshold, missing context, or a workflow configuration error.
This is especially important for finance, HR, customer commitments, and other sensitive workflows.
5. Output quality and business outcomes
Technical success does not always equal useful performance.
A response may be grammatically correct but irrelevant. A tool call may complete successfully but create extra work. A recommendation may be accepted but lead to a poor business result.
Therefore, AI observability should connect system behavior with outcomes such as:
- User acceptance or correction
- Task completion
- Escalation frequency
- Resolution time
- Repeated failure patterns
- Manual rework
- Business impact
- User feedback
Microsoft Foundry’s AI observability framework includes operational metrics alongside quality, safety, groundedness, tool-call accuracy, and task-completion evaluation. This reflects the need to monitor both system health and output quality.
A useful feedback loop should show what the AI recommended, what the user did next, and whether the workflow reached the intended result.
That information helps teams decide whether to improve the prompt, data source, integration, business rule, or user experience.
6. Incidents, containment, and rollback
Production AI also needs incident response.
Organizations should define what counts as an AI incident. Examples may include:
- Unauthorized data exposure
- Repeated incorrect actions
- Harmful or unsafe outputs
- Unexpected tool usage
- Large increases in failure rates
- Actions taken without required approval
- Model or retrieval regressions
The response plan should identify:
- Who owns the investigation
- How to pause the system
- How to disable specific tools
- Whether actions can be reversed
- Which logs must be preserved
- How users are notified
- How the incident affects future deployment
The NIST AI Risk Management Framework Playbook recommends continual monitoring of AI performance and trustworthiness, documenting risks, and remediating components that exceed the organization’s risk tolerance.
This moves AI observability beyond debugging. It becomes part of risk management and operational resilience.
The real observability unit is not the model response. It is the full path from context to action and outcome.
Build AI Observability Into the Workflow
AI observability should not exist only in a separate technical dashboard.
Engineering teams need detailed traces and metrics. However, operations, governance, and business owners also need visibility into actions that affect their workflows.
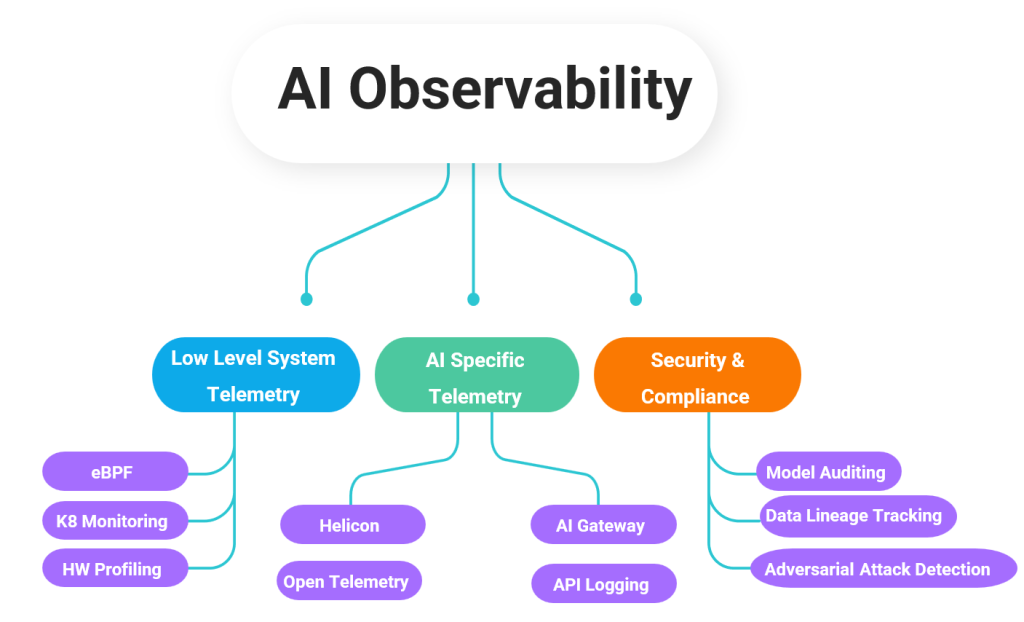
A practical observability design includes four layers.
Structured logging
The system should capture inputs, source data, retrieval results, outputs, tool calls, approvals, and workflow states in a consistent format.
Sensitive information should be protected. Logging everything without access controls can create a new security risk.
Monitoring and alerts
Teams should monitor infrastructure health as well as AI-specific behavior.
Alerts may cover:
- Failed tool calls
- Unusual action volume
- Repeated retries
- Permission errors
- Low-quality responses
- Missing source citations
- Changes in task completion
- Unexpected workflow routes
End-to-end traceability
Every AI action should connect to the user, business record, source data, workflow, and downstream result.
This helps teams move from “the AI did something wrong” to a precise explanation of where the failure occurred.
Review and improvement
Teams need a practical way to inspect incidents, correct outputs, update business rules, and improve the workflow.
The observability system should support both technical debugging and operational review.
This is where Twendee’s role becomes practical.
Twendee designs AI systems with logging, monitoring, and traceability built into the architecture. Twendee can also connect those layers with ERP, CRM, approval workflows, internal platforms, and AI agents.
For example, when an AI agent routes an internal request, the system can record:
- Who initiated the request
- Which records the AI accessed
- Which rule it applied
- Which tool it called
- Whether approval was required
- Who reviewed the action
- What result followed
This gives engineering, operations, and governance teams one reviewable trail.
The goal is not simply to collect more logs. It is to make AI behavior understandable where that behavior creates business impact.
Conclusion
Traditional monitoring shows whether AI infrastructure is available and responsive.
AI observability goes further. It helps teams understand the context an AI system received, the data it retrieved, the tools it called, the actions it took, and the outcomes it produced.
As AI enters production workflows, monitoring, debugging, logging, traceability, and incident response become operational requirements.
Twendee helps businesses build observable AI systems and integrate monitoring and traceability into enterprise workflows and internal platforms. This gives teams the visibility they need to investigate failures, improve performance, and scale AI with clearer control.
Book a call: Calendly
Read latest blog: Enterprise Knowledge Is Moving Beyond Documentation Systems